
Your research, visualised.
A standalone service to make your research pop.


Are your insights found, then lost?
Too often valuable research insights gather digital dust as bullet points, languishing rather than igniting and inspiring teams.
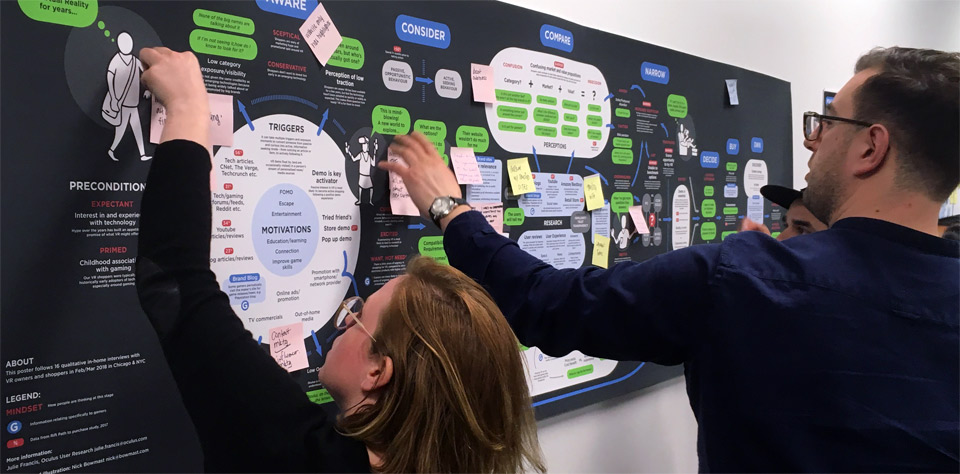
Bring your data and customer’s world to life using the magic medium of narrative imagery, powerful metaphor and graphic symbolism. Nothing beats a human scale poster to get people talking, engaging eyes and minds into action.
A magic medium
I’ve been visualising customer experiences as part of my research projects for over a decade and these artefacts continue to add depth and dimension.
My visuals and training have lit up thousands of eyeballs, started and supported hundreds of engaged conversations amongst teams at; BBC, Facebook, Fitbit, GAP, GoPro, Pinterest, SKY and others, usually well beyond the life of the project.


Map, compass, direction.
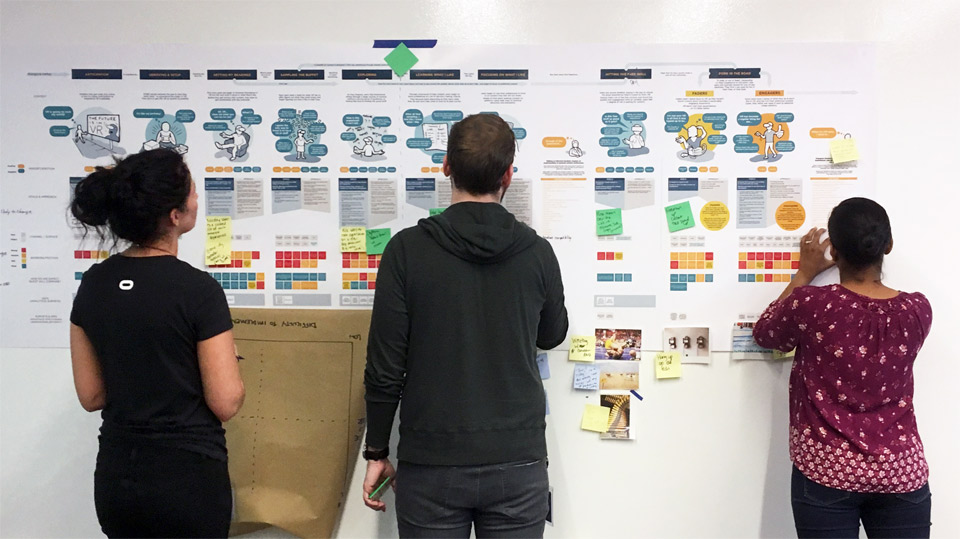
It takes the mind of an experienced researcher combined with the skill of a visual story-teller to render your work accurately, and with impact. Over the years I’ve illustrated journey-maps, service experiences, processes and ecosystems as part of research studies and seen insights gain significant traction as a result.
Now I can offer this visualisation as a standalone service to research, product, marketing, design and strategy teams … and I’m so excited to do so.


How does it work?

You’re ready.
You’ve conducted your research, arrived at a set of key findings. you have a story to tell, and might even have a starting point for a visual to support it. You have an understanding of your audience and how the research-findings should impact their decision making.


Now I’m ready, too.
You walk and talk me through the background and context for your research, the findings, intended use and audience in a briefing call. We define what the critical narratives are and how to prioritise the information. I interview the lead researcher, watch video or read quotes from fieldwork to connect with the voice of the customer.


Initial shape and flow.
I invite you into an online whiteboard where I’ve built a concept model of the visual where you can feel and respond to the messaging and flow. Together, we tweak the narrative and decide where to shine the light or add more detail.


Form and texture.
I create a bespoke visual language and custom graphic symbols/illustrations that support the messaging and weave these into a polished document suitable for large format printing.


Let your insights do the talking.

Use your visual:
To map your customers’ world in a one-shot graphic summary,
As a way to show how interaction and emotion changes over time,
As a human-scale platform for conversations,
To bring the customer voice into workshop sessions,
To bring teams together around a bigger picture,
As an artefact to provoke or inspire response and dialogue.